Monitoring network traffic on a Virtual Private Server (VPS) is critical for ensuring consistent performance, identifying bottlenecks, and protecting against security threats. By tracking metrics such as bandwidth usage, connection counts, and packet flow, administrators can detect unusual activity, prevent resource overuse, and troubleshoot network-related issues before they affect users.
This article focuses on practical command-line tools for real-time monitoring of VPS network traffic, with a brief overview of advanced solutions for long-term analysis and dashboard-based insights.
Key Takeaway:
Monitoring network traffic on a VPS is essential for optimizing performance, managing bandwidth, and ensuring security. Command-line tools like iftop, nethogs, bmon, and vnStat provide real-time and historical insights, while optional systems like Prometheus, Grafana, Netdata, and ntopng offer dashboards, alerts, and detailed traffic analysis. Provider dashboards can supplement monitoring for quick checks, but do not replace in-depth tools.
Understanding VPS Network Traffic
Before using monitoring tools, it’s important to understand the key metrics that describe your VPS network activity:
- Throughput: Measures how much data is transferred over time, typically in bits or bytes per second. Monitoring throughput helps identify bandwidth saturation, heavy file transfers, or services consuming more network resources than expected.
- Packet rate (pps): Indicates the number of packets sent and received per second. High packet rates can reveal network floods, unusually chatty applications, or misbehaving services that generate excessive traffic.
- Connection states: Common TCP states include ESTABLISHED (active connections) and SYN-RECV (connections in the handshake phase). Tracking these states helps differentiate normal activity from potential attacks or misconfigured applications.
- Errors, drops, and retransmits: These metrics indicate packet loss, network congestion, MTU mismatches, or interface issues. Regularly monitoring them allows you to pinpoint performance bottlenecks before they affect users.
Preparing Your Ubuntu VPS for Monitoring
Most VPS monitoring is done via SSH. Connect to your server:
ssh username@your_vps_ip
Update packages:
bash
sudo apt update && sudo apt upgrade -y
Many network tools require sudo or root access to read interface statistics and sockets.
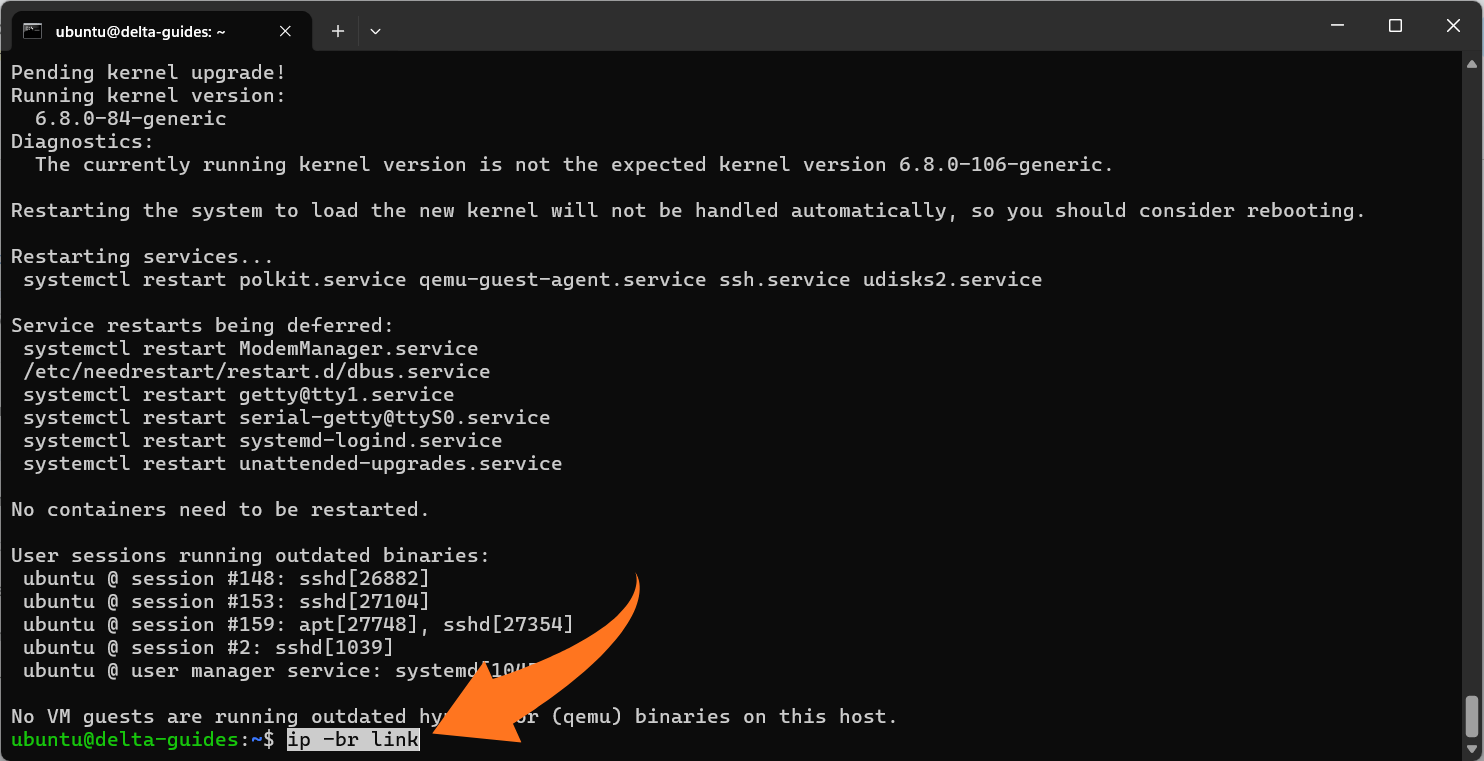
Identify your active network interface (important)
Don’t assume it’s eth0; Ubuntu often uses names like ens3 or enp1s0.
Use one of these:
ip -br link
or (shows which interface is used for outbound traffic):
ip route get 1.1.1.1
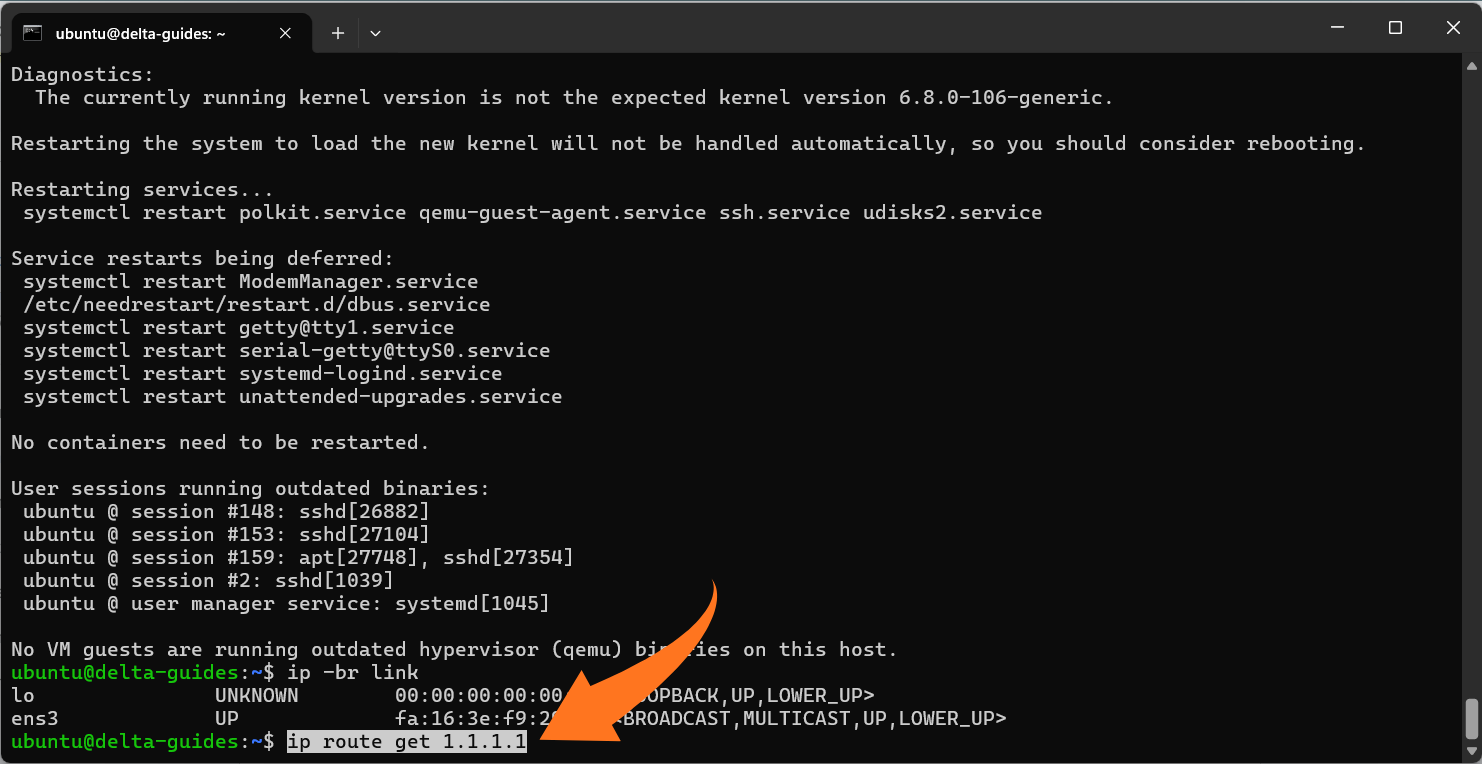
Take note of the interface name (we’ll refer to it as <iface>).
Command-Line Tools for Real-Time Traffic Monitoring
Monitoring network traffic on a VPS can be done efficiently using lightweight command-line tools. Each tool serves a different purpose, from real-time analysis to long-term usage tracking. Below is a clear breakdown of the most commonly used tools.
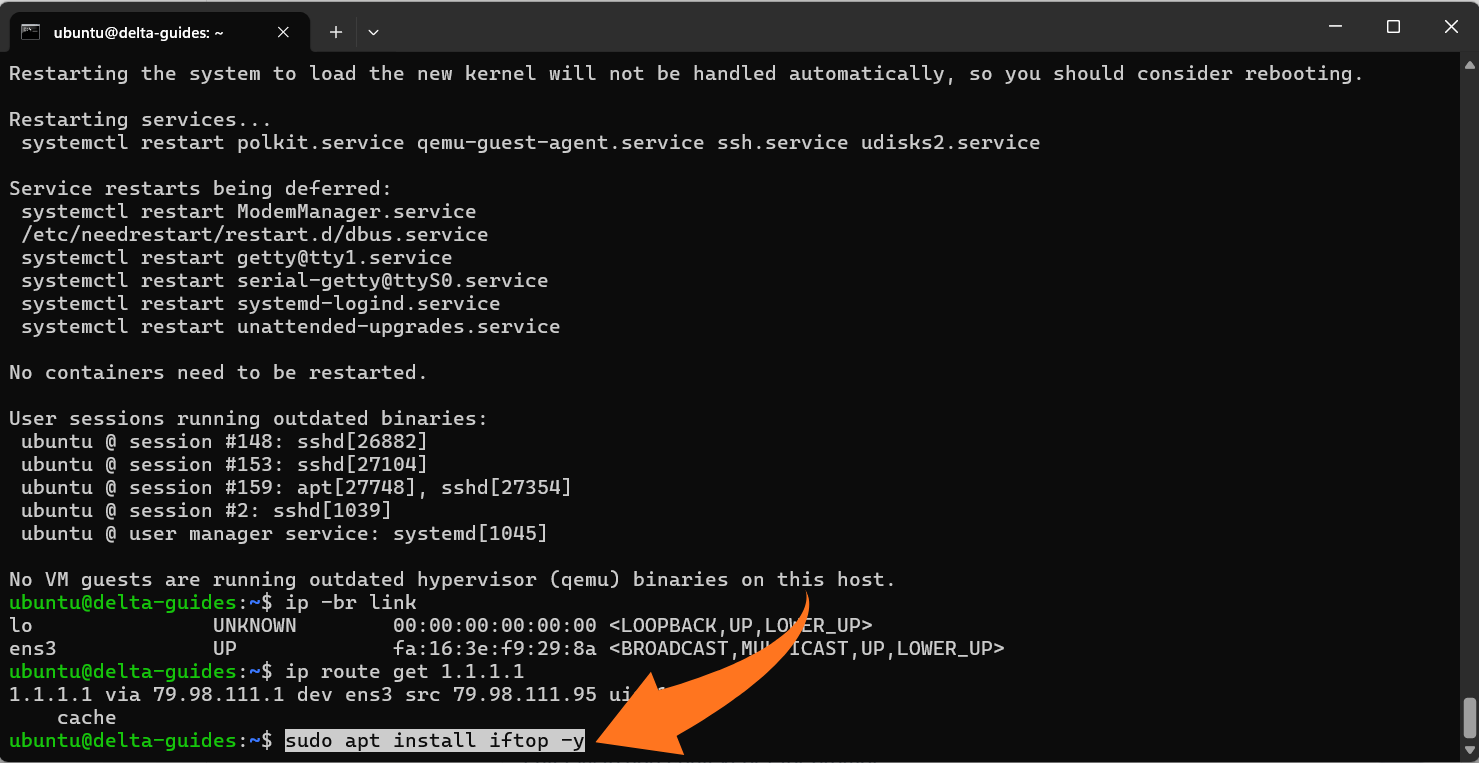
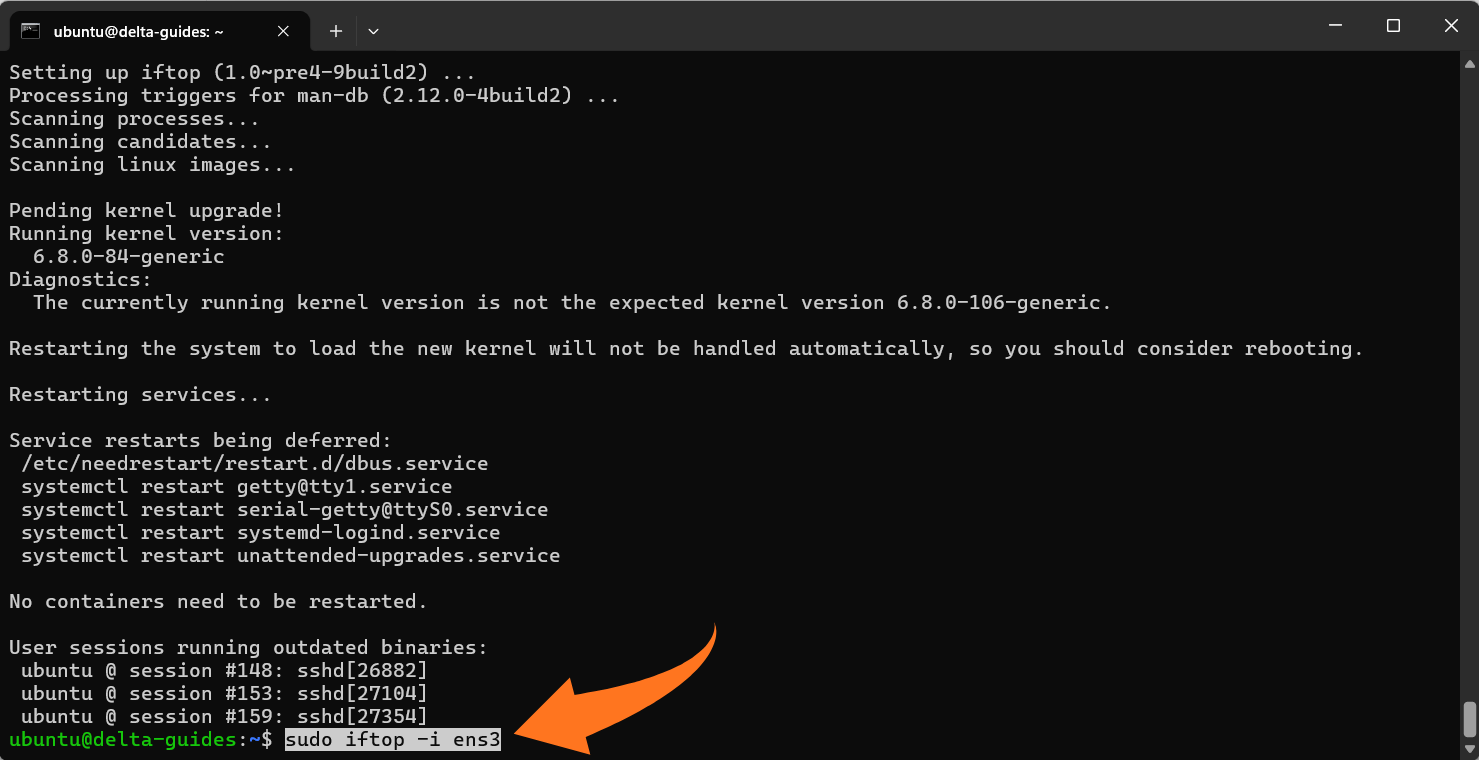
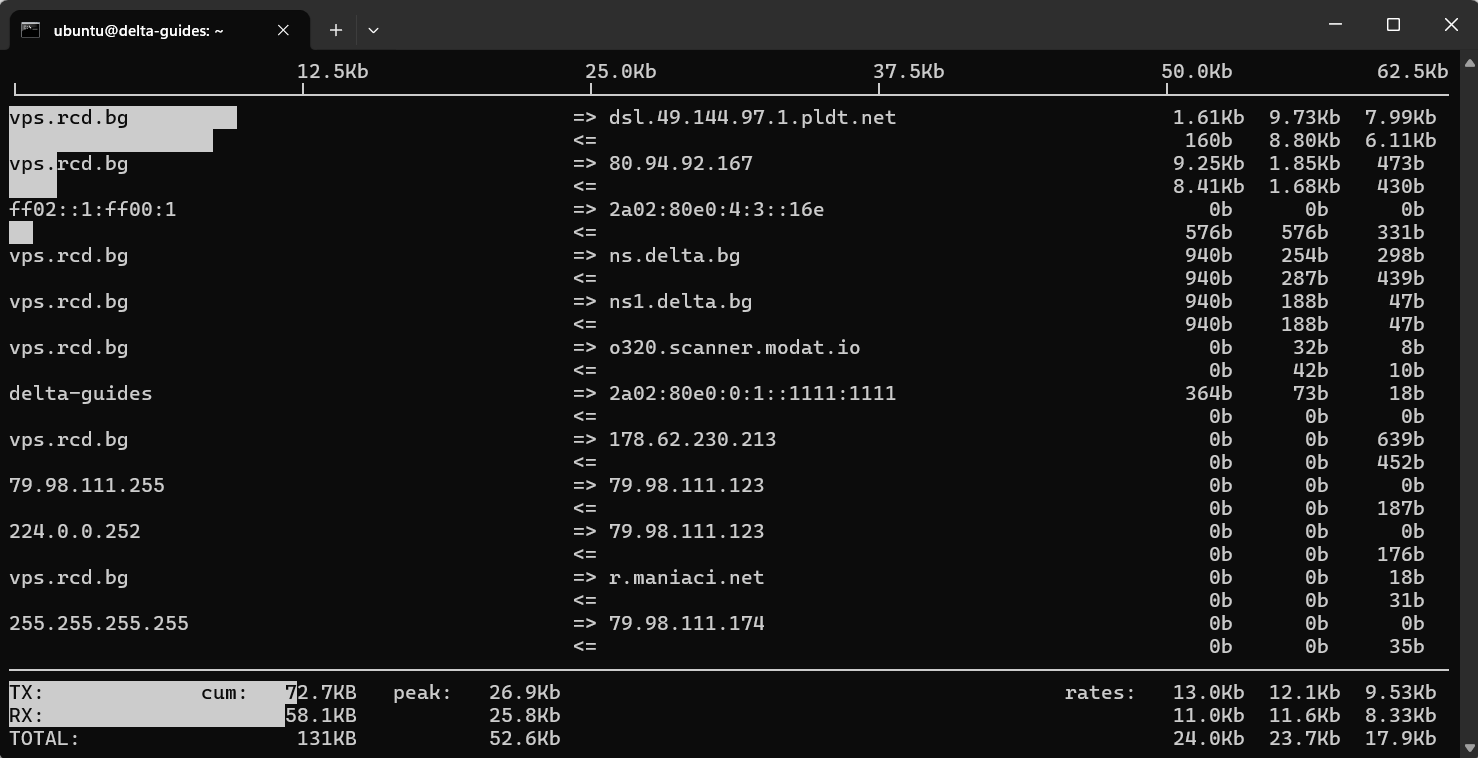
1. iftop (Bandwidth per Connection)
iftop displays live bandwidth usage for each connection, helping identify which remote hosts are consuming the most network resources. This is useful for spotting spikes or unexpected high-traffic connections.
Install:
sudo apt install iftop -y
Run (replace <iface> with your network interface, e.g., ens3):
sudo iftop -i <iface>
Notes:
- Shows top talkers and current traffic rates in a continuously updating view.
- Best for immediate troubleshooting when performance issues occur.
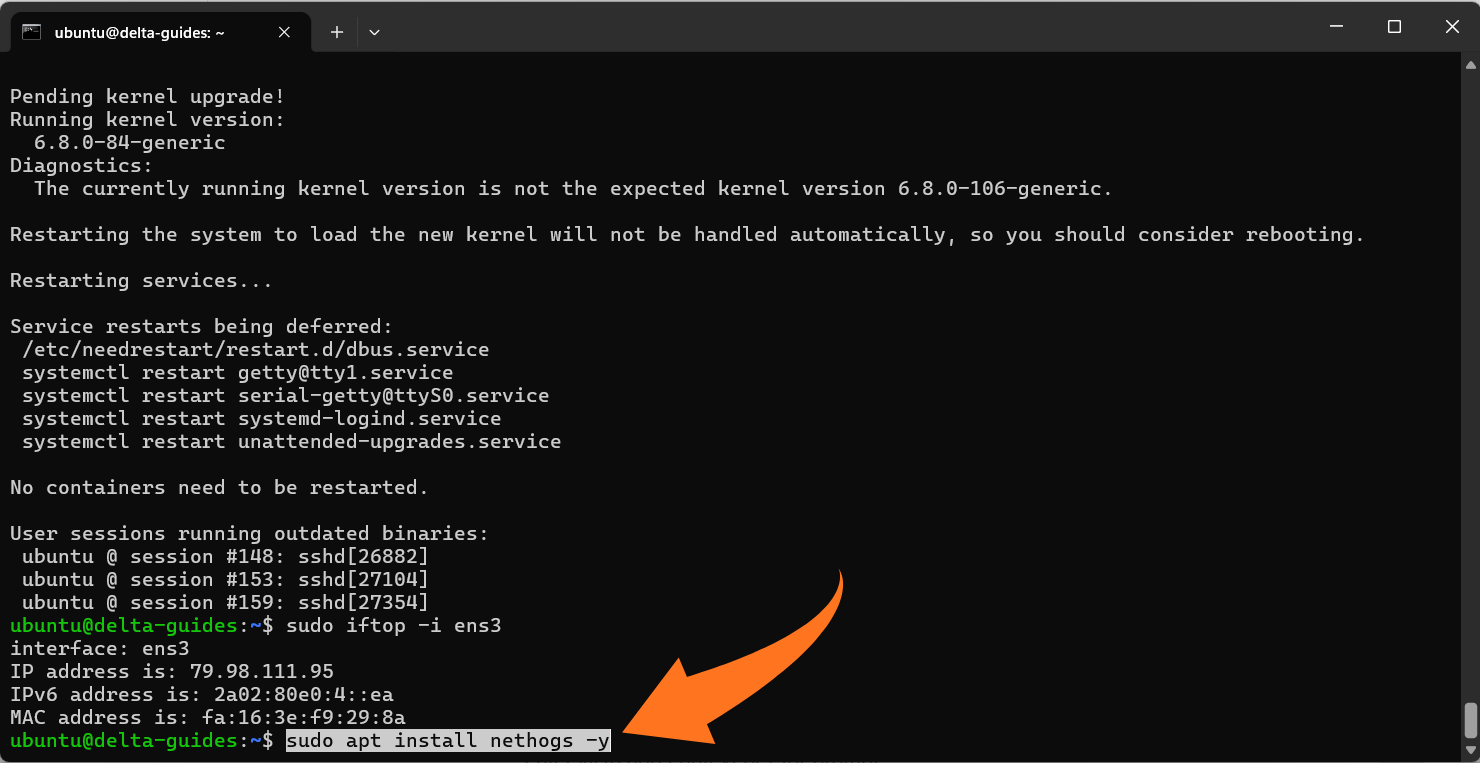
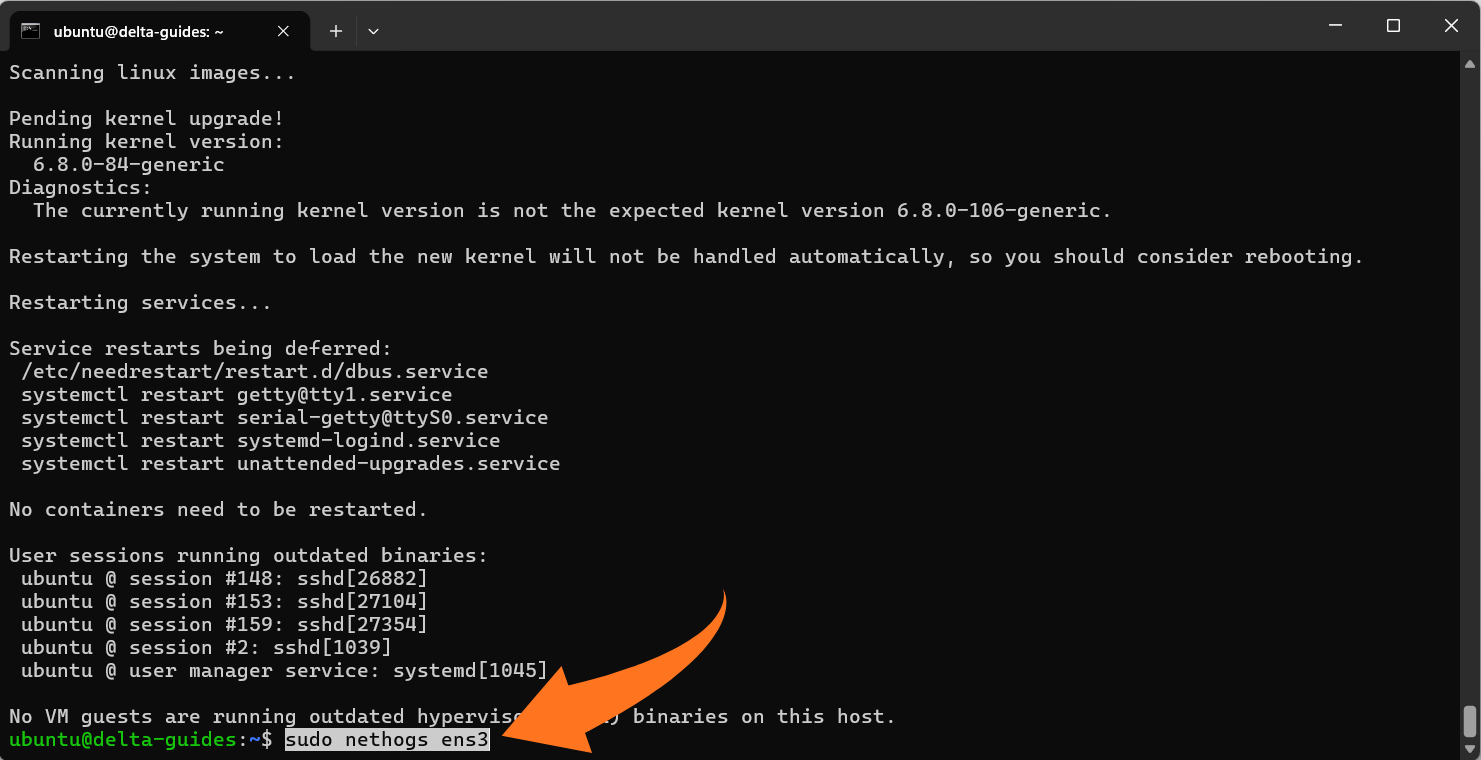
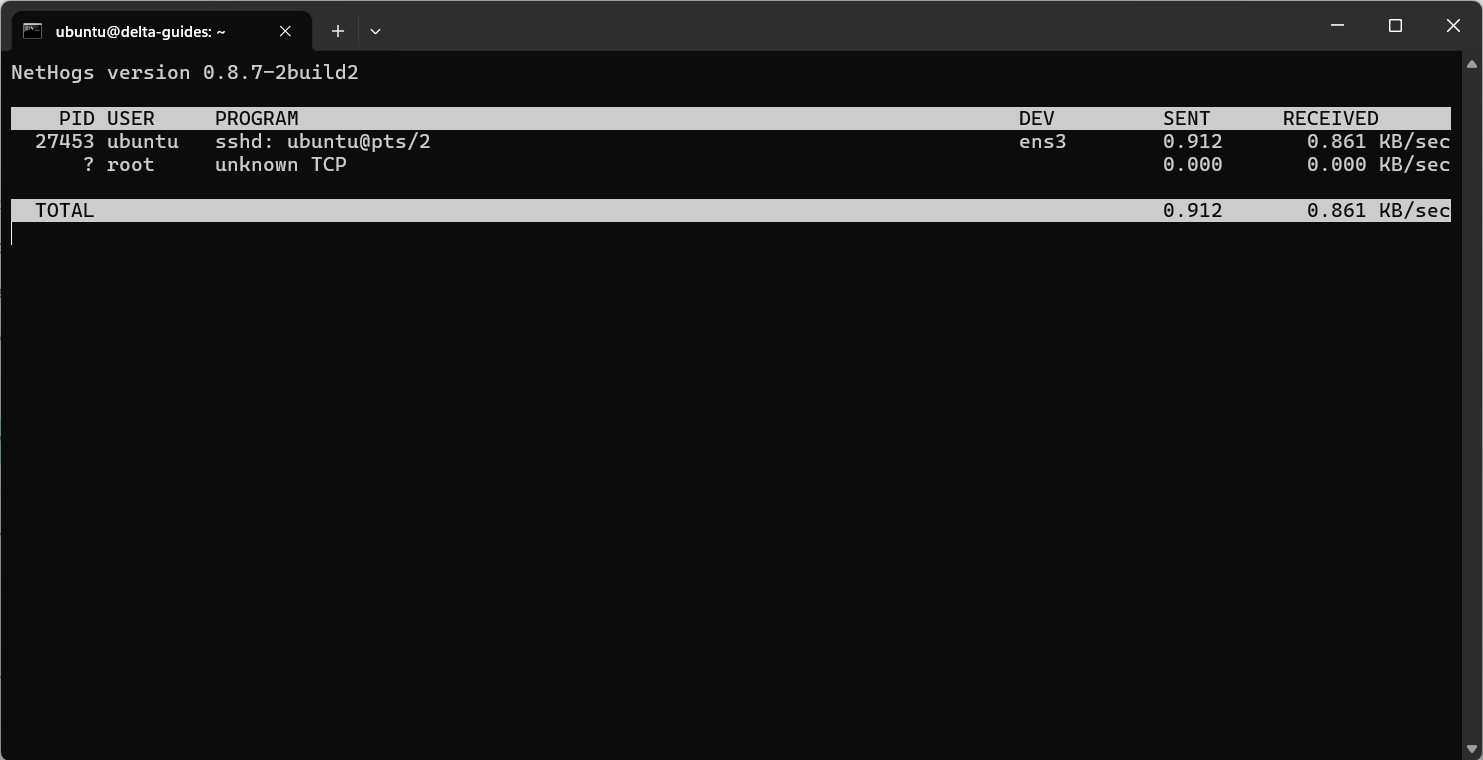
2. nethogs (Bandwidth per Process)
nethogs tracks bandwidth usage per process, allowing you to see which applications are generating network traffic. This helps identify misbehaving services or resource-heavy applications.
Install:
sudo apt install nethogs -y
Run:
sudo nethogs <iface>
Notes:
- Displays process names, PIDs, and live send/receive rates.
- Process attribution may be inaccurate for very short-lived connections, but it is effective for identifying persistent traffic sources.
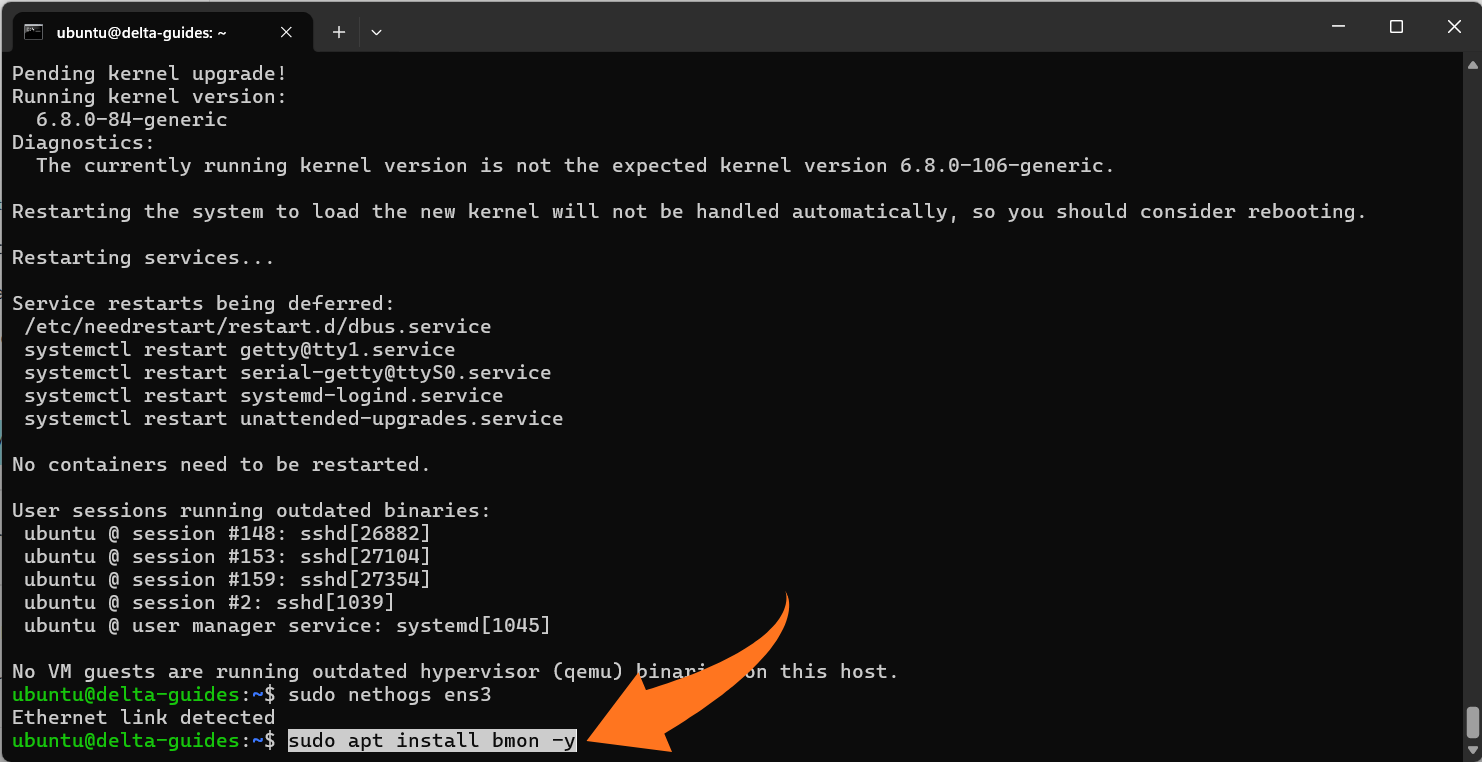
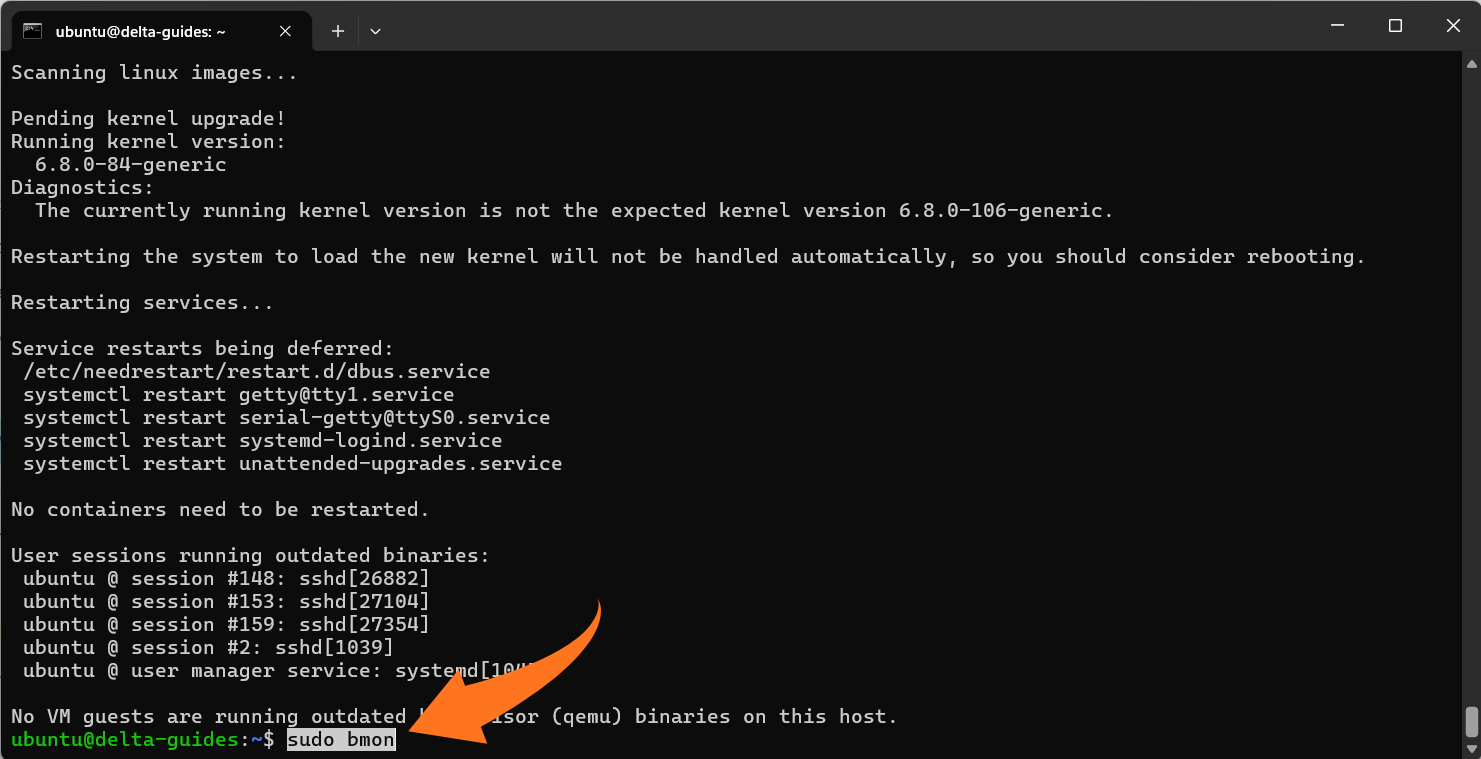
3. bmon (Bandwidth per Interface with Graphs)
bmon provides a terminal-based visual representation of inbound and outbound traffic per network interface. This is helpful for quickly checking interface utilization.
Install:
sudo apt install bmon -y
Run:
sudo bmon
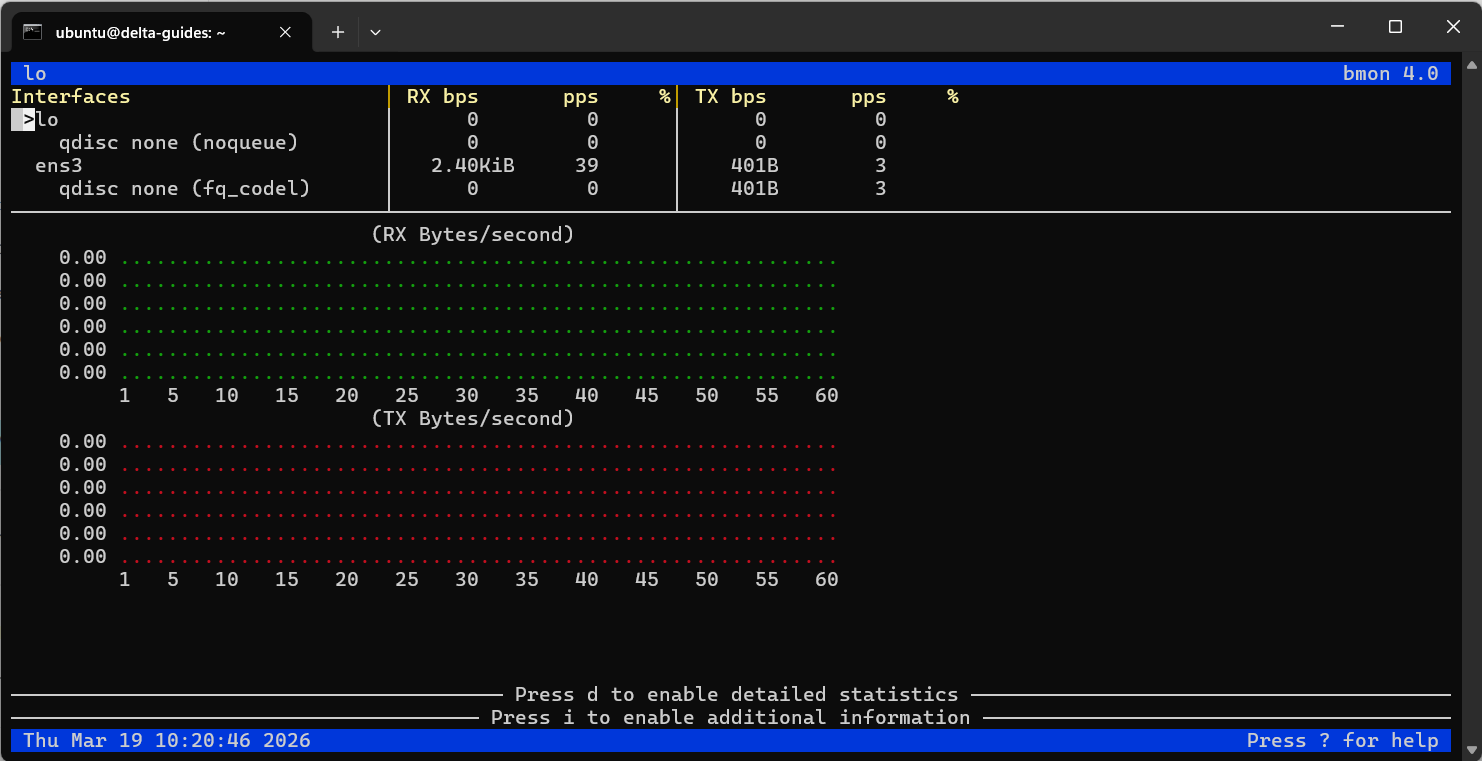
Notes:
- Offers simple graphs for monitoring multiple interfaces simultaneously.
- Ideal for spotting trends and verifying interface activity at a glance.
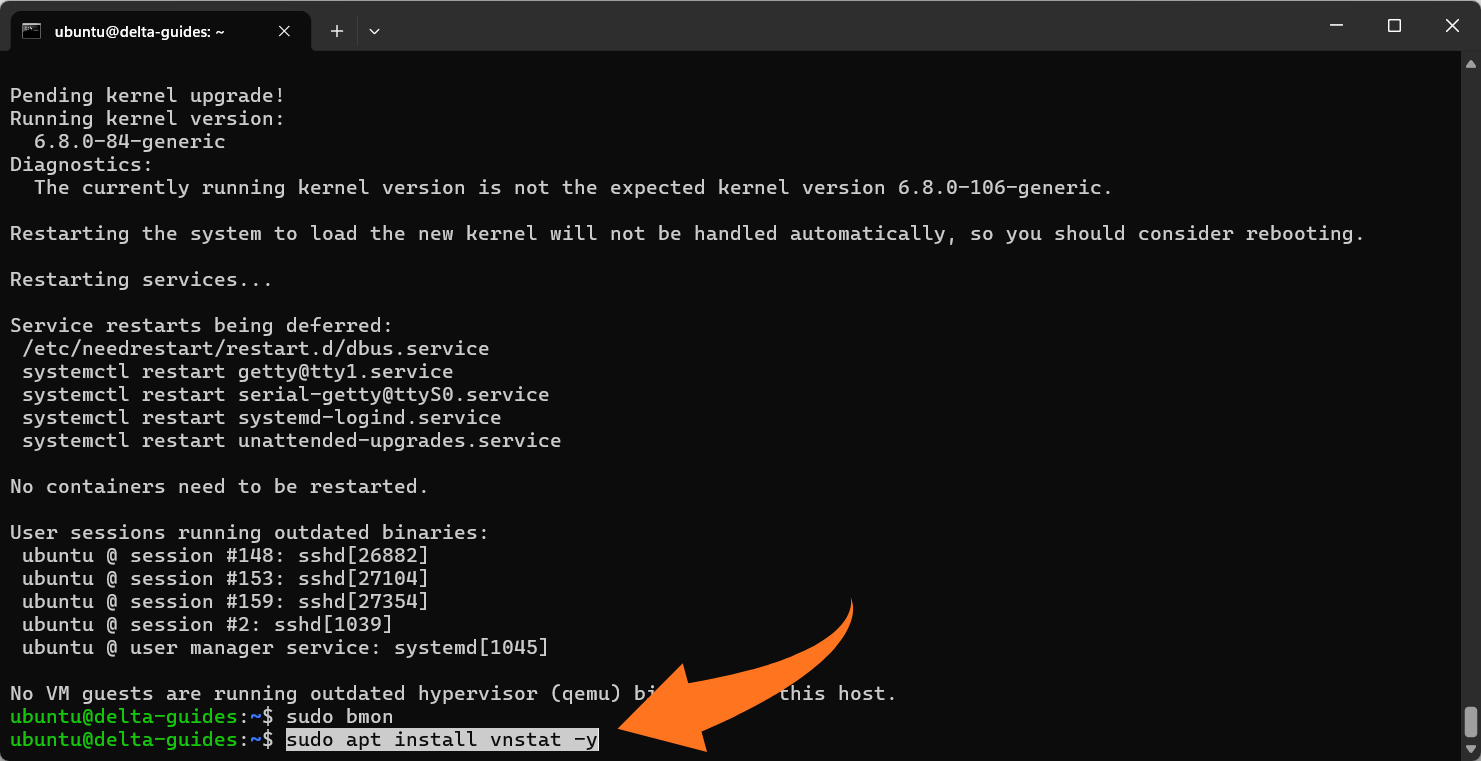
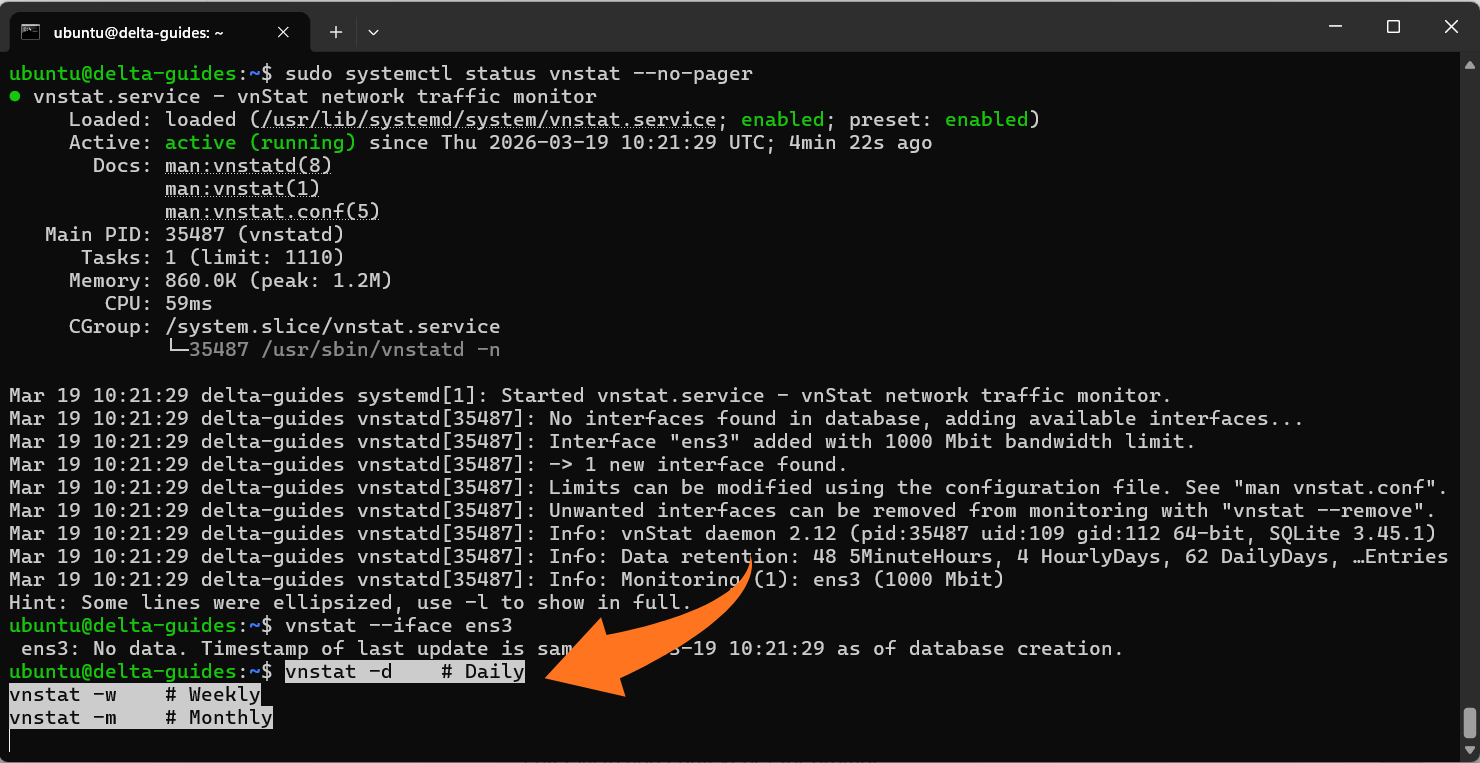
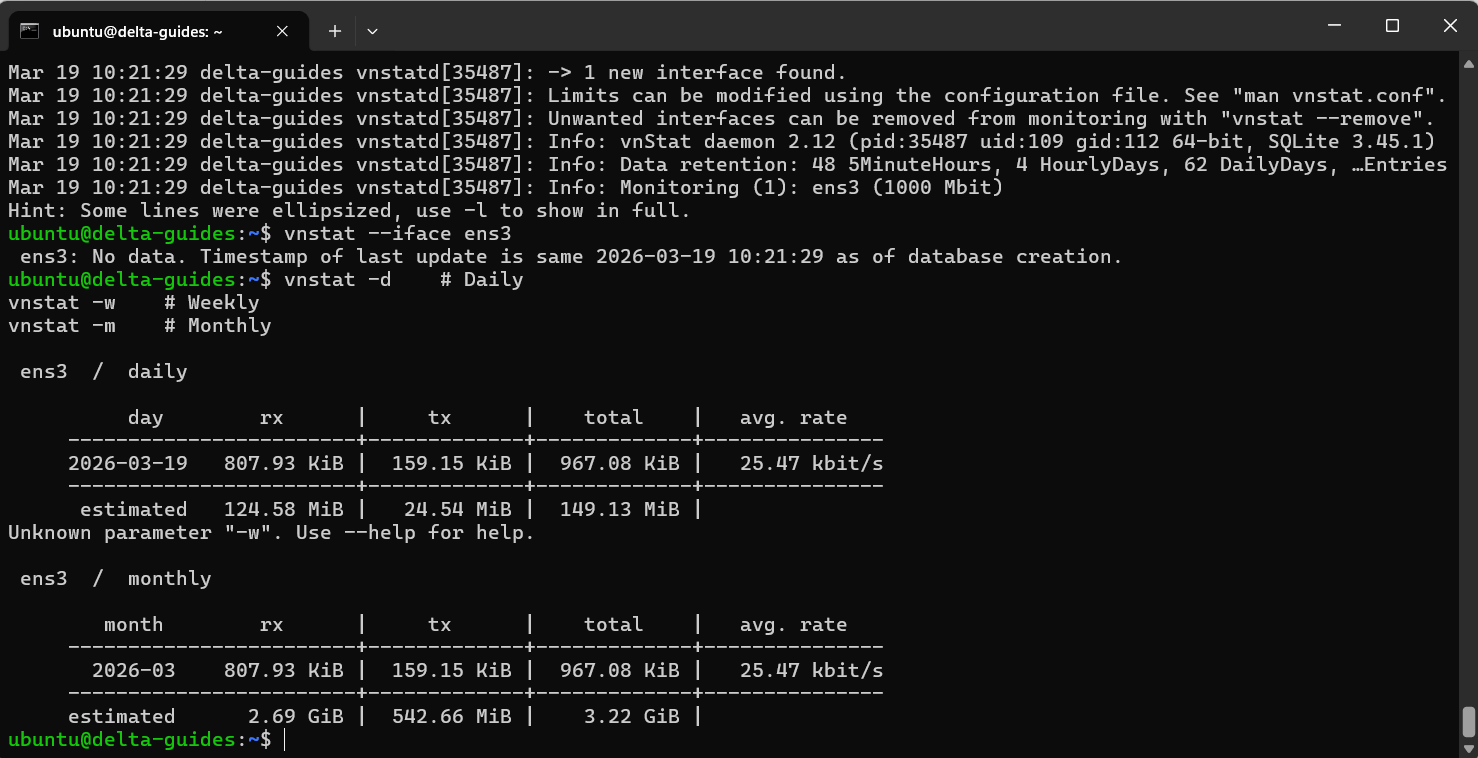
4. vnStat (Long-Term Bandwidth Tracking)
While real-time tools are useful for “right now,” vnStat is designed to log network usage over time with minimal system overhead. It supports daily, weekly, and monthly reports.
Install:
sudo apt install vnstat -y
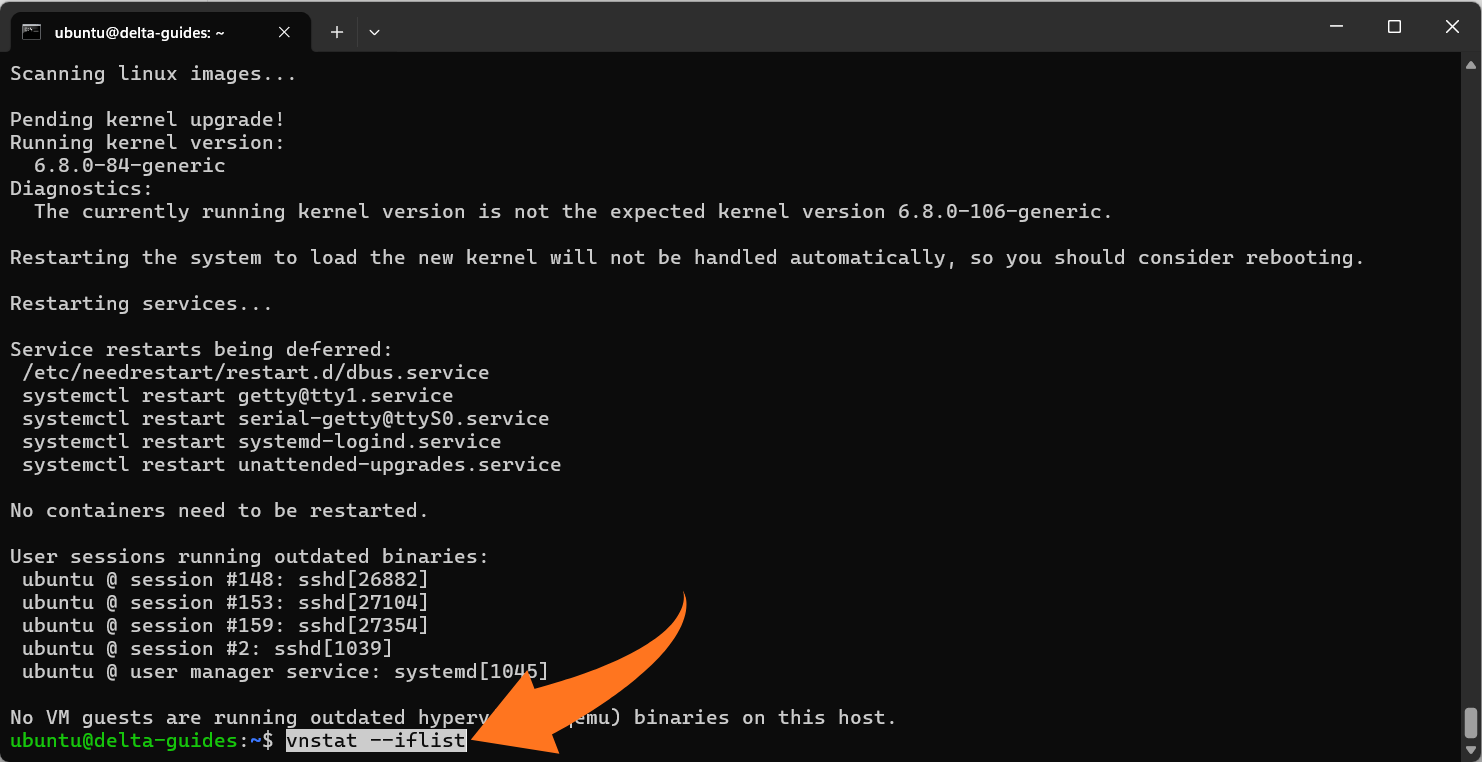
List available network interfaces:
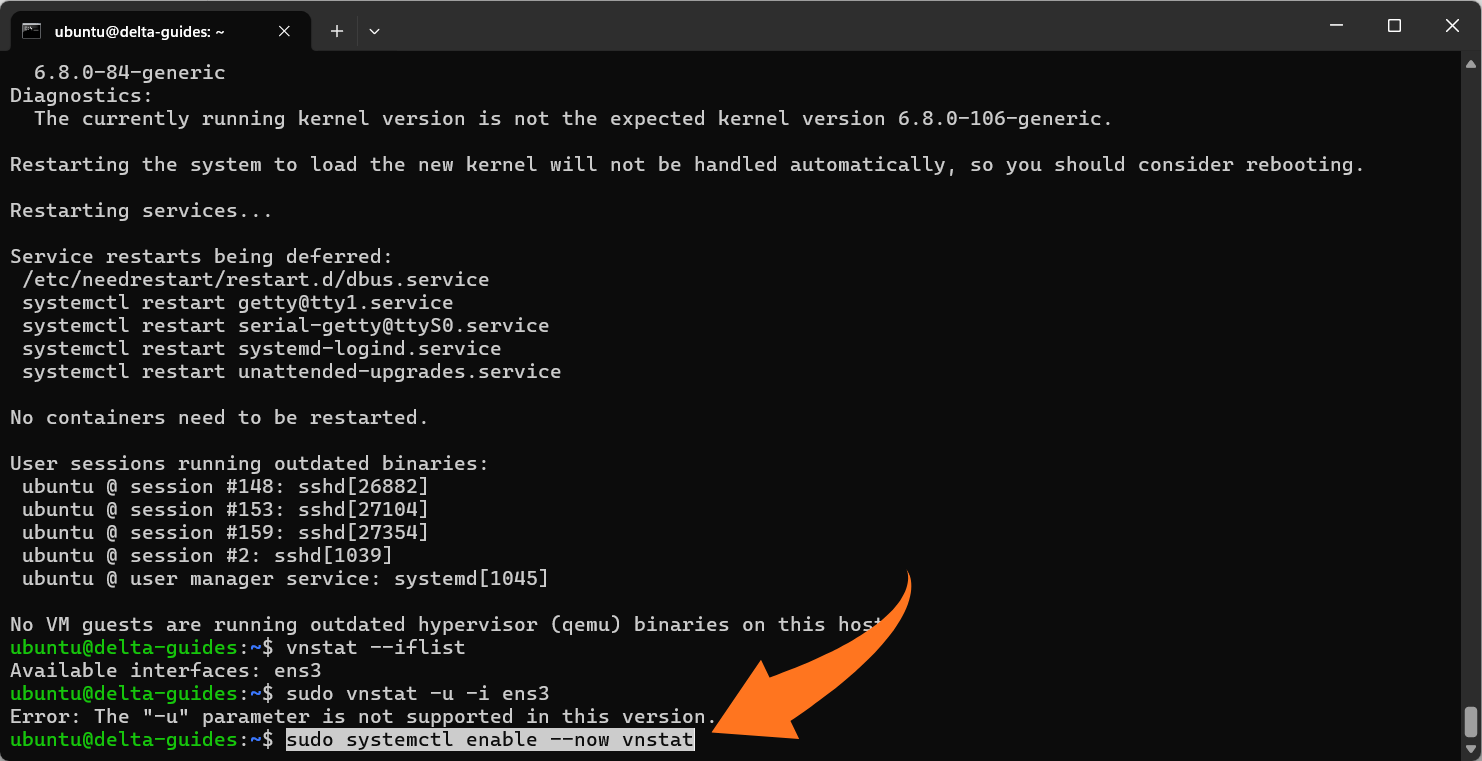
vnstat --iflist
Initialize tracking for your interface:
sudo vnstat -u -i <iface>
Enable and start the vnStat service:
sudo systemctl enable --now vnstat
View usage reports:
vnstat -d # Daily
vnstat -w # Weekly
vnstat -m # Monthly
Notes:
- vnStat collects data continuously in the background. Initial reports may take a few minutes to populate.
- Ideal for tracking long-term bandwidth trends and detecting recurring network issues.
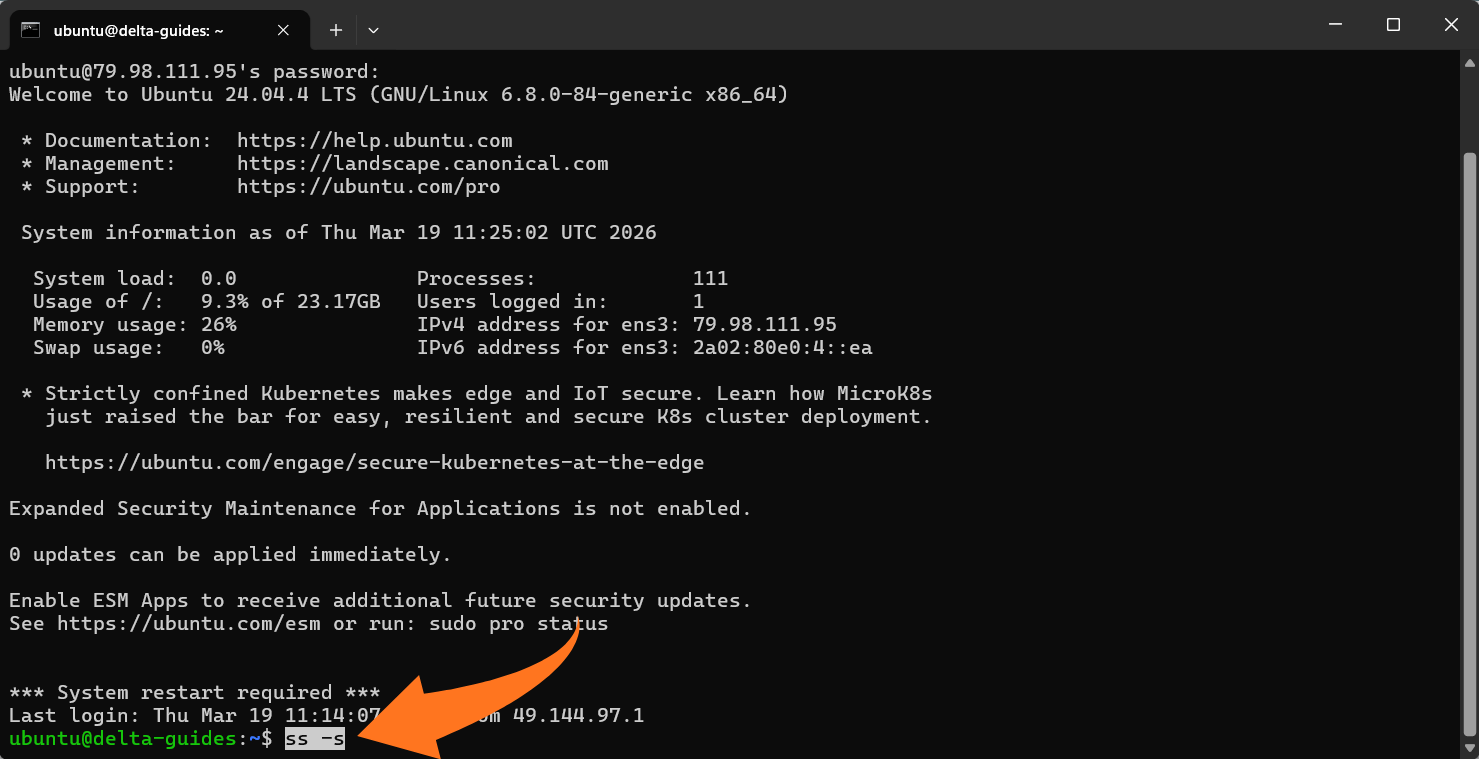
Quick Reality-Check Commands for Troubleshooting
Sometimes you need immediate insight into your VPS network health. The following commands provide a fast view of connection states, packet errors, and potential issues without installing additional tools.
View a summary of all sockets and connection states:
ss -s
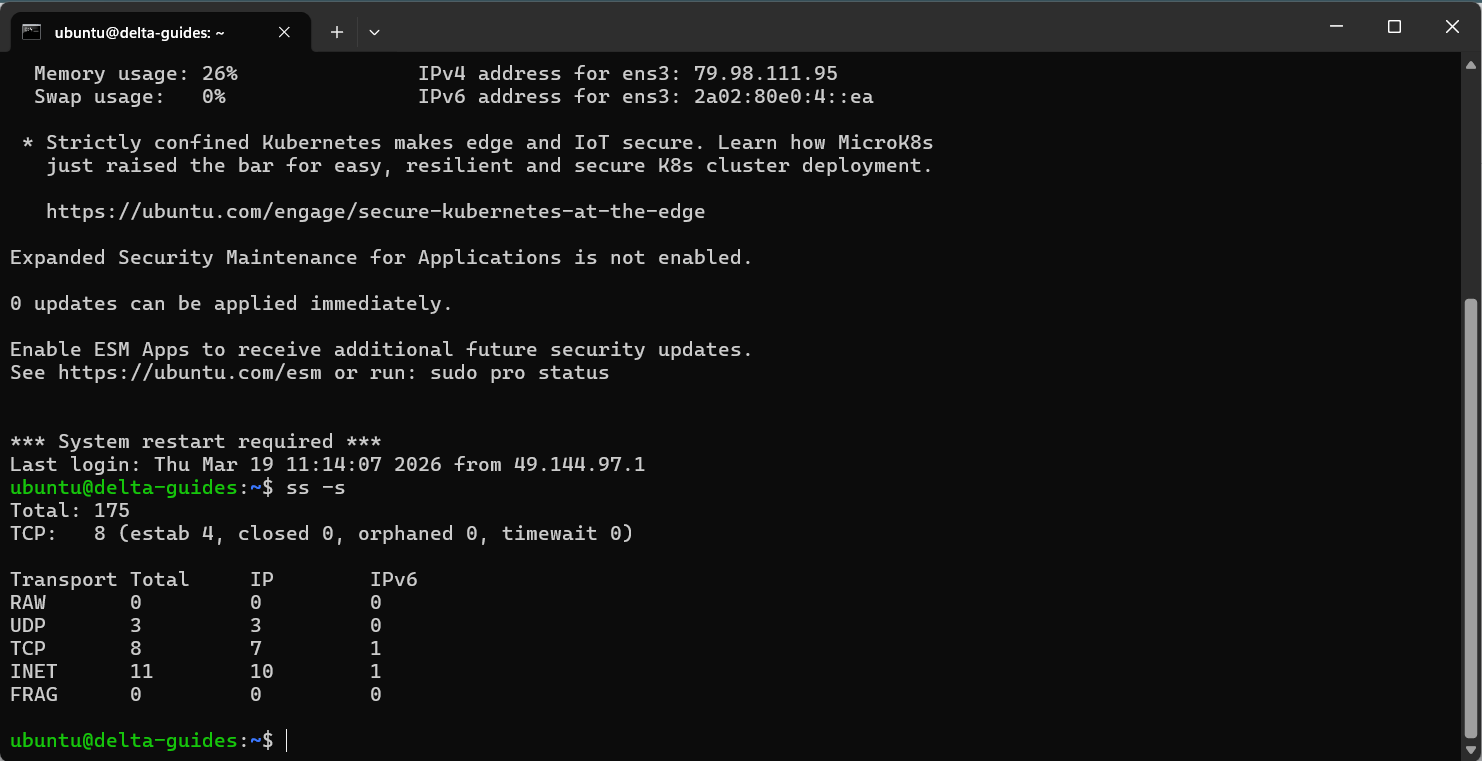
- Displays totals for TCP, UDP, and other protocols.
- Shows counts of ESTABLISHED, SYN-RECV, and other connection states.
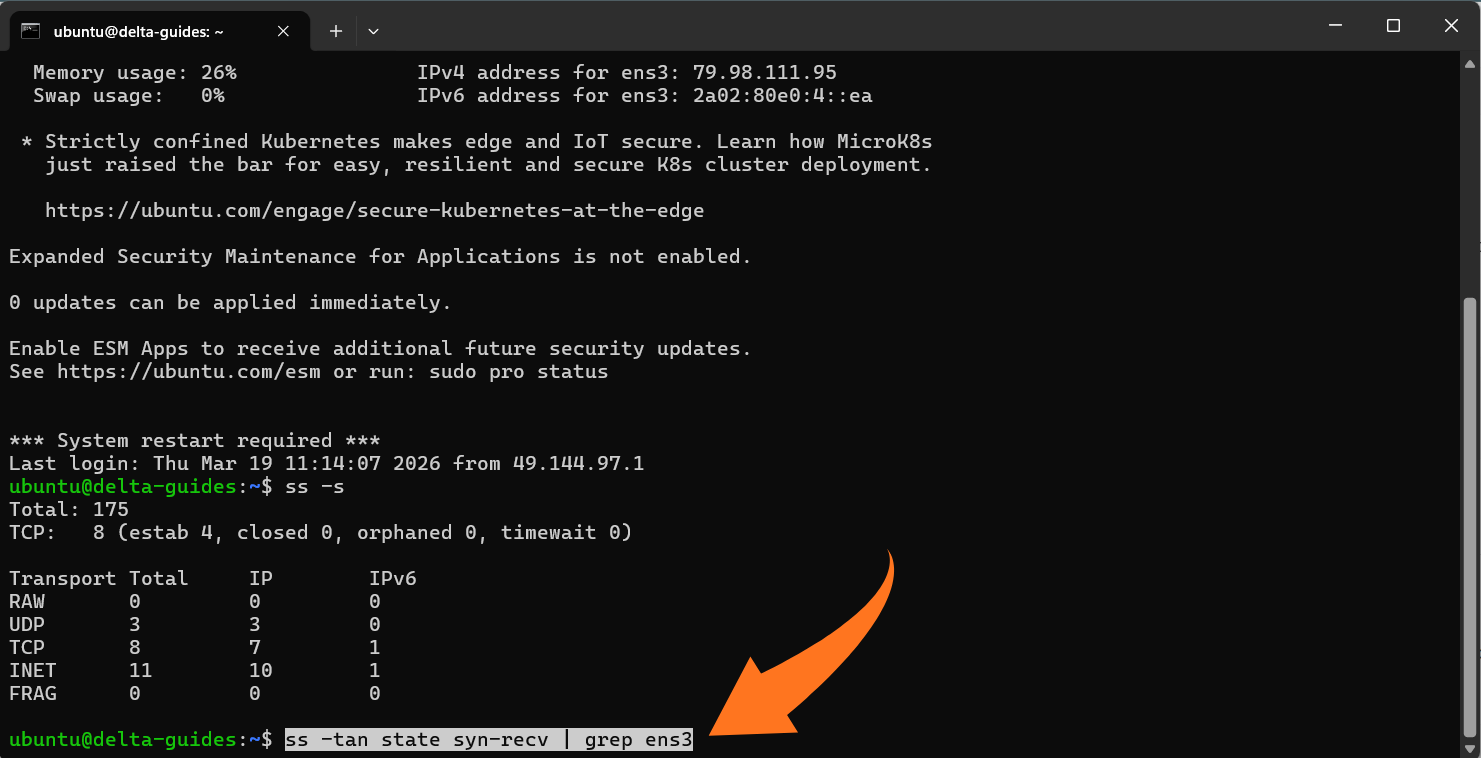
Inspect half-open TCP connections (SYN-RECV), which may indicate SYN floods or scanning activity:
ss -tan state syn-recv | head
Notes for interpretation:
- ESTAB: Established connections.
- SYN-RECV: Connections in the handshake phase, waiting for the final ACK.
- High SYN-RECV counts: May indicate a denial-of-service attack, port scanning, or misconfigured service.
Note: Empty output is normal if your VPS has no half-open connections at the moment.
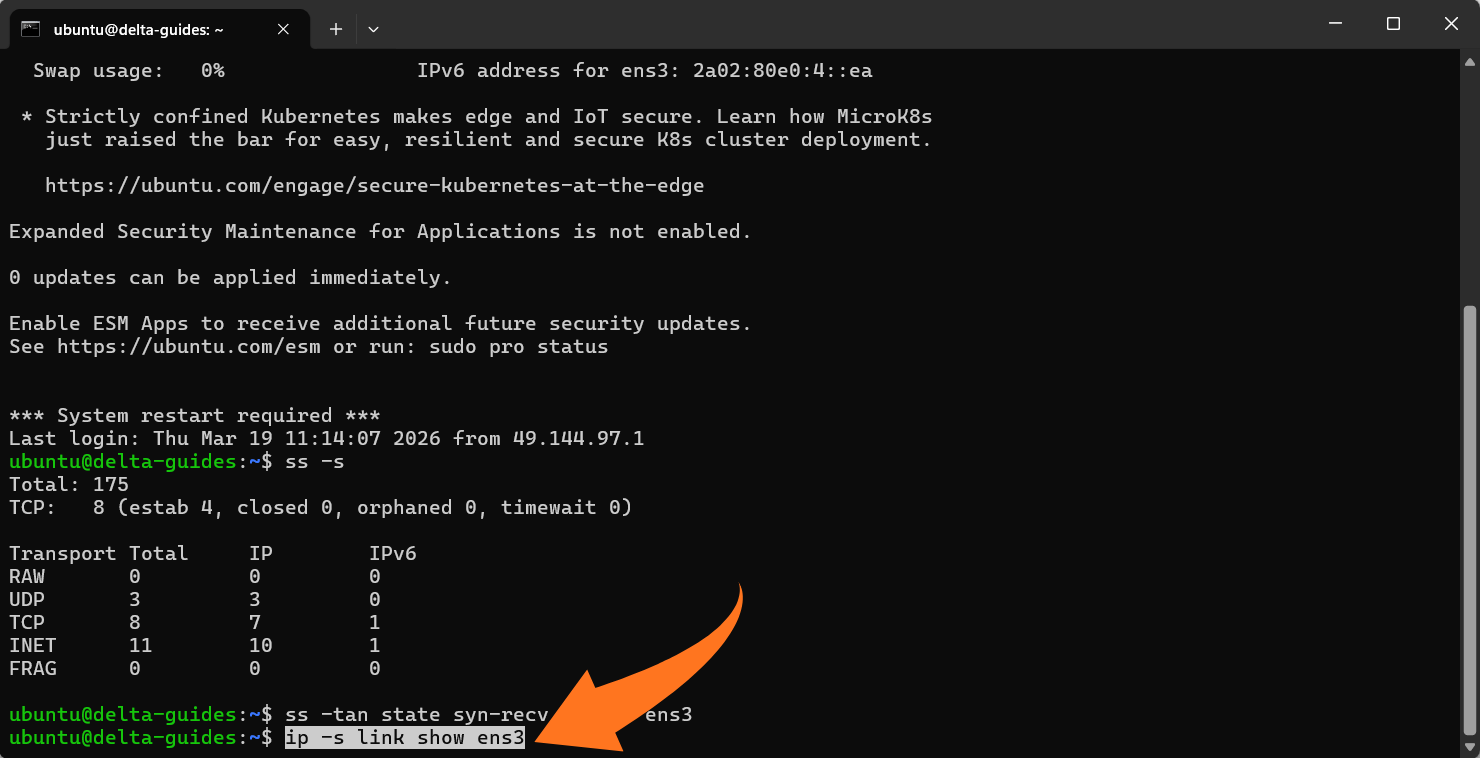
Check Drops and Errors on Network Interfaces
Even if bandwidth looks normal, packet drops, errors, or collisions can degrade performance. Use the following command to inspect interface statistics:
ip -s link show <iface>
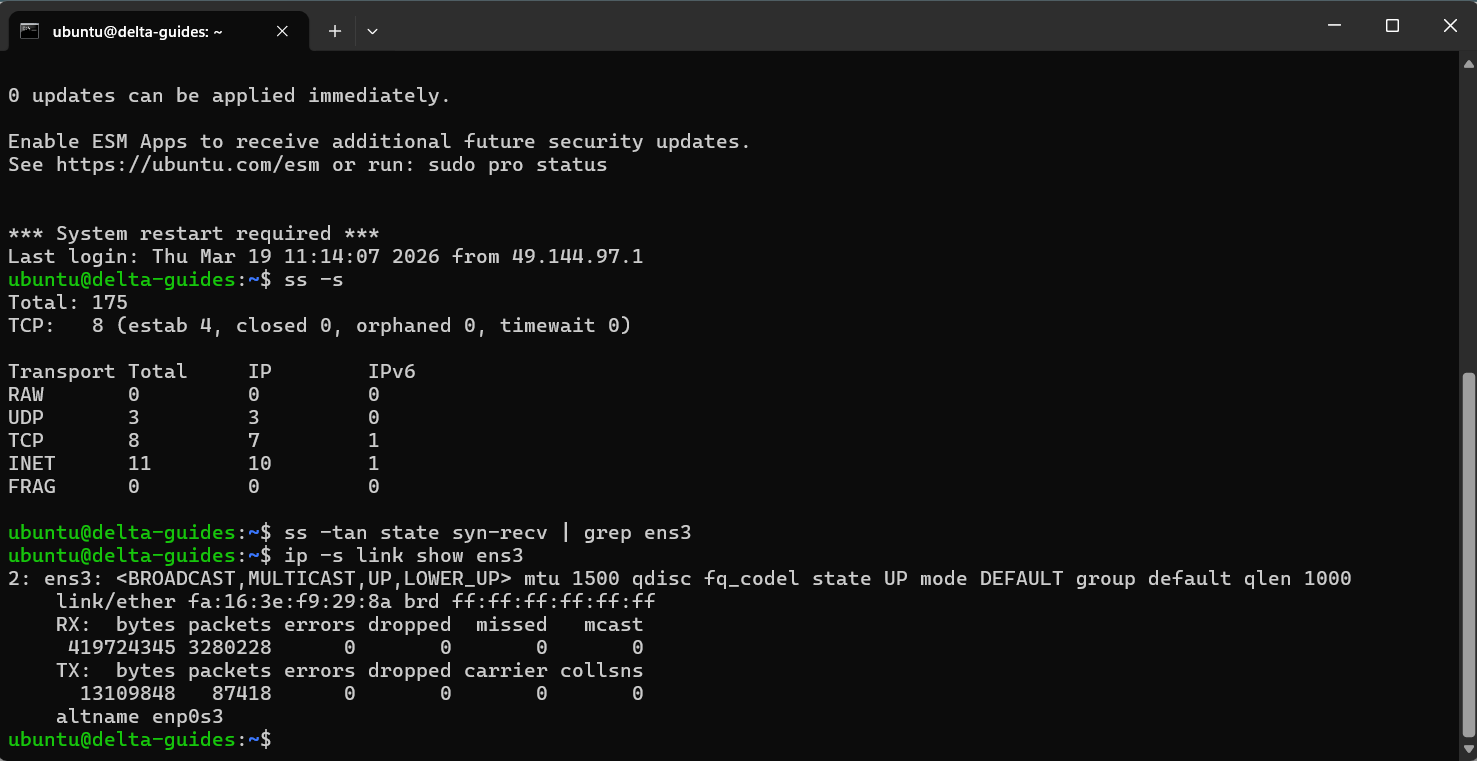
Notes:
- Replace <iface> with your network interface name (e.g., ens3).
- Look for nonzero counts under RX errors, TX errors, or dropped packets. Persistent errors may indicate network congestion, driver issues, or misconfigured MTU settings.
- This command helps you identify underlying problems that may not appear in standard bandwidth monitoring.
Advanced & Visual Monitoring Tools (Optional)
For administrators who need dashboards, alerting, and long-term analysis, command-line tools provide immediate insight, but visual monitoring systems offer deeper visibility and proactive management. The following tools are widely used in modern VPS environments:
Prometheus + Grafana
Prometheus collects system and application metrics in a time-series database, while Grafana visualizes this data in interactive dashboards. On a VPS, the node_exporter component exposes CPU, memory, disk, and network metrics to Prometheus.
Netdata
Netdata provides a lightweight, real-time monitoring solution with a web-based interface. It updates metrics every second, covering CPU, RAM, disk, and network usage.
Ntopng
ntopng focuses on detailed network traffic analysis, providing insights beyond overall bandwidth. It identifies flows, protocols, hosts, and traffic patterns.
Optional Provider Dashboards
Some VPS providers offer built-in dashboards or control panels that display network metrics such as incoming/outgoing traffic, CPU load, memory usage, and bandwidth trends. These dashboards are generally less detailed than advanced tools but provide value in specific scenarios:
- High-level overview: Quickly verify VPS performance without SSH access.
- Initial diagnostics: Identify unusual traffic spikes or resource usage before using more granular tools.
- Supplementary monitoring: Use alongside command-line or advanced tools for a holistic view.
At Delta.BG, we provide graphs showing CPU load and RAM usage for our Cloud VPS and Windows VPS services.
Conclusion
Effective network traffic monitoring is essential for maintaining a high-performing, secure VPS. Using command-line tools like iftop, nethogs, bmon, and vnStat provides both real-time visibility and historical usage insights, enabling you to spot anomalies and optimize bandwidth efficiently.
For administrators seeking dashboards, alerting, and deeper analysis, solutions like Prometheus + Grafana, Netdata, or ntopng offer advanced capabilities, though starting with command-line monitoring remains the most practical approach for most VPS setups.
To experience a VPS environment optimized for monitoring and performance, explore our Cloud VPS and see how it supports both real-time and long-term server insights.
